CERF Blog
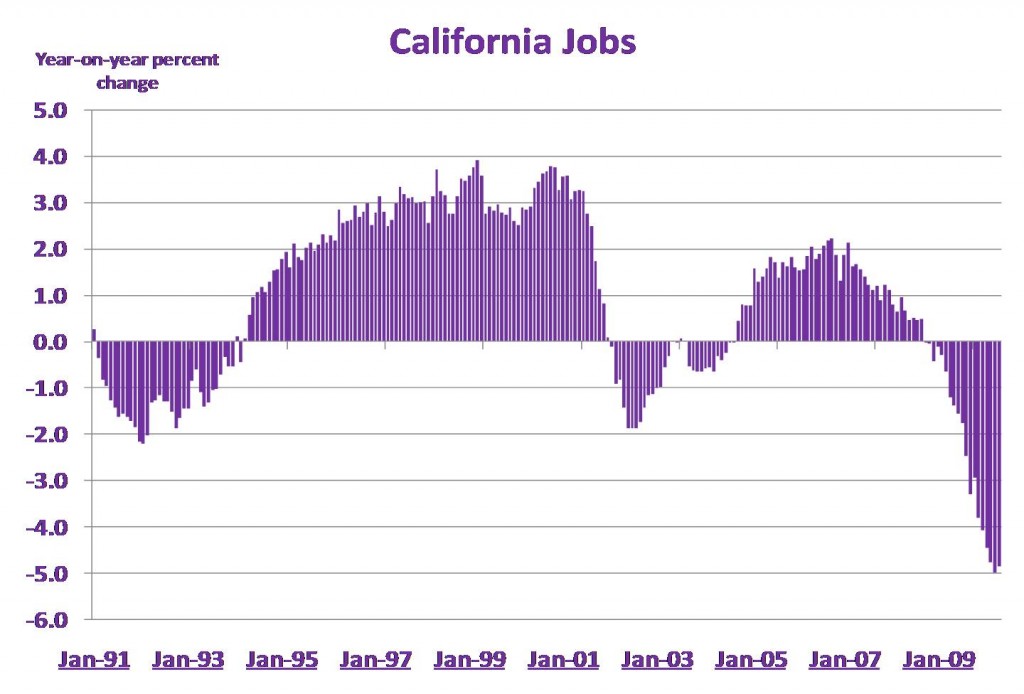
In November of 2008, we substantially revised our forecast of mid-year 2009 California year-on-year job growth from a fall of about one percent to a fall of about five percent. At the time, we felt like we were in the midst of a regime-shift to a different state of economic affairs. This new state was one characterized by a financial crisis and this was accompanied by a massive change in private-sector risk tolerance. We felt the economy was changing faster and more dramatically than most other forecasters. Our revised forecast moved us deep into pessimistic territory compared with the consensus view.
The California Employment Development Department released the July 2009 jobs report August 21, 2009. Reviewing the year-on-year changes in jobs shows the California job-count was down 4.9 percent or 749,300 jobs. The June 2009 year-on-year decline was 5 percent, see the chart below. These recent job declines indicate California’s worst job market since 1984. The data confirm our view, one we have held since November 2008. The state of economic affairs changed in a very big way during fall 2008.
Jobs data have historically been lagging-indicators of economic activity. What indicators can we watch that provide a more forward-looking view? These would include the Ted Spread (see Bill’s recent blog), foreclosures, and new building activity. At this time, these indicators are still bullish. The normalized Ted Spread is high, foreclosures are high, and new building activity is low.


