CERF Blog
Introduction
The BEA published updated Ventura County Gross Domestic Product (GDP) figures Thursday, December 7, 2023. The release provides revisions to all U.S. county-level GDP measures for the years from 2017 to 2021, and provides previously unreleased estimates for 2022. Strikingly, in 2022, Ventura County’s GDP contracted by 0.4 percent, whereas Los Angeles County’s economy expanded by 2.1 percent and the broader U.S. expanded by 1.9 percent.
Previously Unavailable Data
The release provided economic growth estimates for 2022, the first time that the BEA has provided estimates for that year. The Ventura County estimate for 2022 is for a contraction of 0.4 percent, whereas Los Angeles County’s economy expanded by 2.1 percent, the state’s economy expanded by 0.7 percent, and the average of all counties across the U.S. expanded by 1.9 percent. It is remarkable that Ventura County experienced an economic contraction in 2022, a year in which the nation was still expanding from the 2020 recession. Ventura County’s 2022 job growth was 4.4 percent, illustrating a continuation of a dynamic that CERF has documented before, namely, that job growth is in relatively low-paying sectors which provides jobs, but does not provide income and GDP growth for our county.
Revisions to Previous Estimates
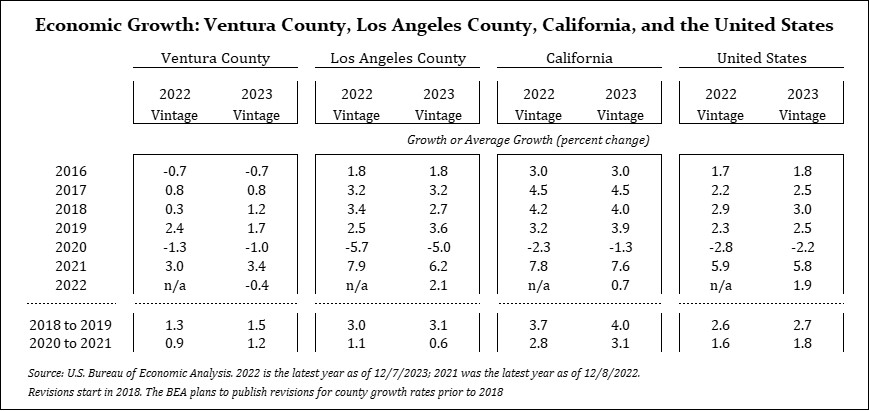
The release provided revisions to GDP data prior to 2022. Ventura County economic growth was revised up in 2018 (from 0.3 to 1.2 percent), down in 2019 (from 2.4 to 1.7 percent), up in 2020 (from -1.3 to -1.0 percent), and up in 2021 (from 3.0 to 3.4 percent).[1] Comparing revisions to average growth rates pre and post-pandemic, Ventura County’s averages, pre and post-pandemic both rose post-revision. The 2018-19 average was 1.3 percent growth, while its post-revision average is 1.5 percent (Table 1), and the 2020-21 average was 0.9 percent, while its post-revision average is 1.2 percent. I applaud the upward growth revisions, however, given that Ventura County experienced seven percent economic growth during 2000 through 2007, a relatively normal episode of history, these upward growth revisions are relatively small.
Table 1: Economic Growth
To provide further perspective, Table 1 also shows the economic growth revisions for Los Angeles County, California, and the United States. As was the case for Ventura County, growth revisions for both California and the United States were up compared to previous estimates. California’s pre-pandemic growth was revised up from 3.7 to 4.0 percent, and its post-pandemic growth was revised up from 2.8 to 3.1 percent. The U.S.’s pre-pandemic growth was revised up from 2.6 to 2.7 percent and its post-pandemic growth was revised up from 1.6 to 1.8 percent. Using the latest estimates, Ventura County’s average 2018 to 2019 pace of growth was 46 percent slower than the U.S. and its 2020 to 2021 growth was 31 percent slower.
Regional Comparisons
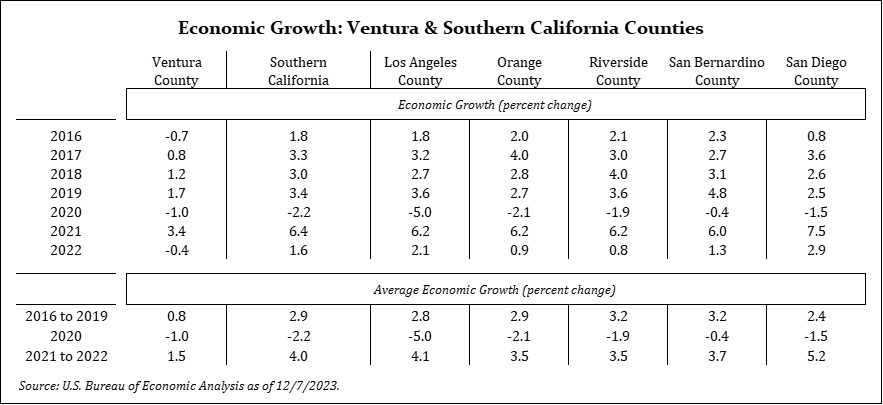
To provide further perspective Table 2 provides the BEA’s latest growth figures for Ventura County as well as for Southern California counties. Ventura County was the only Southern California county to experience economic contraction in 2022. Ventura County’s 2022 contraction of 0.4 percent compares to the regional Southern California average of an expansion of 1.6 percent. This is a significant comparison, indicating our county’s lack of growth relative to neighboring counties for which Ventura County has significant economic inter-dependencies.
Table 2: Economic Growth – Southern California Comparison
Episodes of Growth
The lower panel in Table 2 provides measures of economic growth across three episodes, pre-pandemic (2016 to 2019), pandemic (2020), and post-pandemic (2021 to 2022). From this comparison we see that while Ventura County performed well-below the Southern California region in both the pre-pandemic and post-pandemic episodes, our county outperformed the region during the pandemic, and as well, outperformed the state and the nation.
CERF has emphasized the relative superiority of our County’s policy-response to the Pandemic in previous analyses. Our county’s leaders led the state in efforts to re-open small businesses and schools, and to keep these establishments open longer in the face of COVID transmission waves. This effort is visible in the County’s growth data, where the contraction during the 2020 recession was noticeably less severe than most of its peers, and was less than half as severe as the contraction experienced across all counties in the United States. This illustrates the often repeated CERF analysis that policy matters. Allowing economic activity, for businesses and for households, versus shutting down economic activity, has significant impacts, especially for lower-income households.
While Ventura County’s policies during the Pandemic were superior, the county’s status quo economic development and land use policies, which prevailed for the 20 years prior to the pandemic, are among the most restrictive in the United States. These policies matter too. They exert a strong headwind on the activities of Ventura County households and businesses. CERF desires to initiate a county-wide conversation about the benefits of changing those policies to allow and to promote economic growth, for the benefit of all of its citizens, and simultaneously, for the benefit of our local and regional governments as well.
CERF’s Annual Economic Forecast Event
To this end, CERF is planning for Growth to be the main theme of our upcoming February 2024 Economic Forecast event, the county’s premier networking event. This year’s conference will provide a comprehensive assessment and outlook of the county’s economy and demography. The event, and the associated publication, among many other things, will feature a deeper dive into the data described in this article. It will also include a Ventura County forecast provided by CERF’s Matthew Fienup, other nationally recognized speakers, and most importantly, stories from Ventura County citizens about their experiences, illuminated by the policies in which we operate. For more information regarding the details of the 2024 Ventura County Economic Forecast event, please visit: https://www.clucerf.org.
[1] “2022 Vintage” indicates BEA County GDP data published 12/8/2022, whereas “2023 Vintage” indicates GDP data published 12/7/2023 (see Table 1).


